
Here, the symbolization of a dataset is determined.
One theme can be divided into several classes. This can be used for different symbology depend on characteristics of the data set and / or it can be used for different symbology depending on scale.
The name of each class will be displayed next to the symbol in the legend and order in the legend is determined by the order of the tabs. The name of a class can be changed by right clicking on the tab. The order is decided by dragging & dropping tab.
A class can have multiple styles / styles. This may for instance be used to indicate a line should be solid color in the background and a phantom line in different color over.
Example:
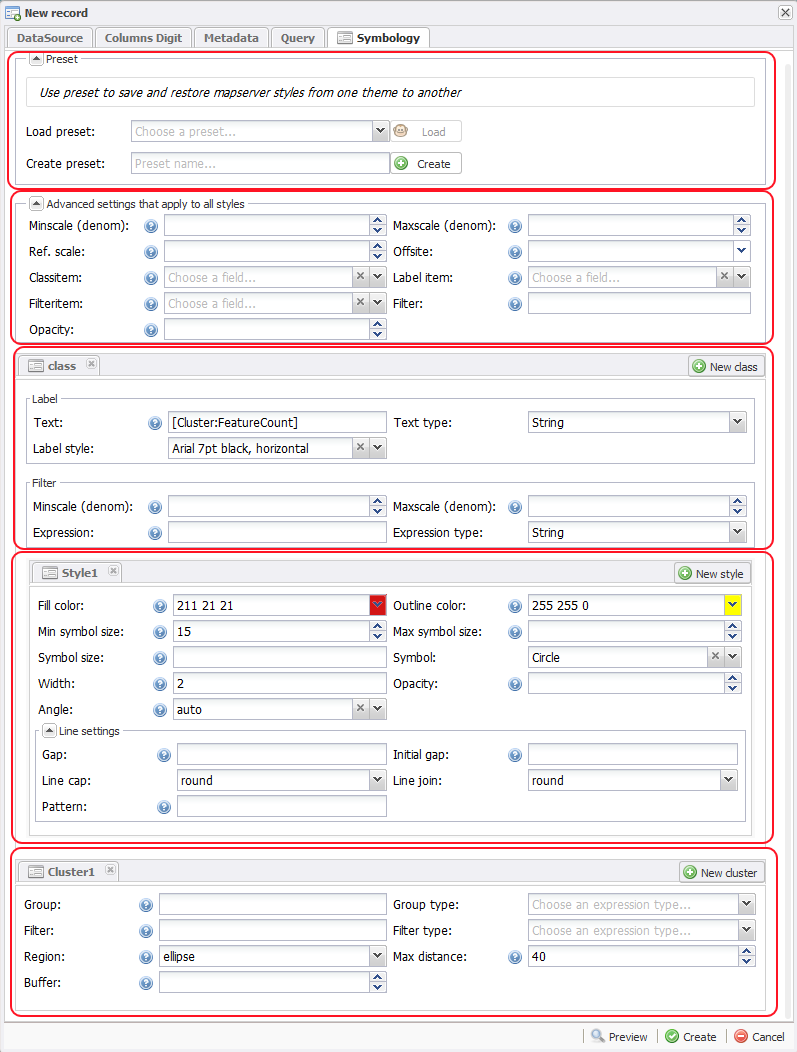
![]()
The order of the styles / style corresponds to the order of the tabs and decide which one is drawn first => bottom. The order is decided by dragging & dropping tab.
The figure below is categorized by
- Preset (stored setup classification / symbolization)
- Advanced setting (one set of settings that apply to all classes and styles)
- Class (settings in relation to classification – determine object’s class)
- Style (settings in relation to the symbology)
- Cluster (settings in relation to the symbology – clustering means a dense/unified point which represents several points). Applies only point theme.
| Name | Description | ||||
| Preset | |||||
| Load preset | Recalling one saved layout relative to classification / symbolization. Relevant topics will be automatically classified / symbolized according saved blade assembly against. | ||||
| Create preset | Save one finished layouts compared to classification / symbolization. This can be reused on other topics | ||||
| Advanced settings | |||||
| Minscale | Enter minimum scale theme to appear. Integer specified. | ||||
| Maxscale | Enter max scale theme to appear. Integer specified. | ||||
| Ref. scale | The scale when symbols and / or text appear full size. This allows for dynamic scaling of objects based on the map section / gauge. If not set so the symbol is always displayed with the same size. Scaling occurs only within the limits of “MINSCALE” and “MAXSCALE” described above. Sees also connections with “My symbol size” and “Max symbol size” under style / styles.
|
||||
| Offsite | Only applicable to raster data. Enter RGB color is to be transparent (0 values in the raster). Example, if black will be transforming the pair entered this: 0 0 0 | ||||
| Classitem | Select column whose values it to be classified. If properly are classified based on several properties using a non «Classitem”. | ||||
| Labelitem | Select column whose values will be used for inscription / label. If it should be inscription from other properties employs a not “Labelitem”. | ||||
| Filteritem | Select column that can be used with the “Filter”. This is to distinguish away parts of the dataset based on features. Applies only to Shape Files and databases without spatial / spatial addition. | ||||
| Filter | Set filter to separate out parts of your dataset. Used together with “Filteritem” | ||||
| Opacity | Set the transparency of the theme. Enter integer from 0-100.
A value of 100 is opaque and 0 is fully transparent. If no value is specified will be the same as opaque. |
||||
| Klasser | |||||
| Text | Used to enter inscription / label based on several properties and / or a standard text for all objects in the dataset. This as an alternative to “LabelItem.”
Example: [objtype] – [name] Used together with “Text type”. In the above example used “Text type” = String.
|
||||
| Text type | Set type “Text.” Advanced use of text, ref. For details: mapserver.org/mapfile/class.html | ||||
| Label style | Select the font style to be used. It can be established more font layouts, see the section on configuring Adaptive. | ||||
| Minscale | Enter minimum scale for class to appear. integer specified | ||||
| Maxscale | Enter max scale for class to appear. Integer specified. | ||||
| Expression | Enter value it should classified by. Used together with “Type” and “Classitem.”
It has three possible behaviors:
|
||||
| Expression type | Expression type type expression. Used together with “Expression”. | ||||
| Stilarter/styles | |||||
| Fill color | Fill Color. Use Color Picker or enter the RGB value, RGB values will have space between R, G and B. Example: 255 0:00 | ||||
| Outline color | Use Color Picker or enter the RGB value, RGB values will have space between R, G and B. Example: 255 0:00 | ||||
| Min symbol size | Minimum size in pixels for one symbol to appear. Integers or decimals. Viewed in conjunction with “Ref. scale “ | ||||
| Max symbol size | Maximum size in pixels for one symbol to appear. Integers or decimals. Viewed in conjunction with “Ref. scale “ | ||||
| Symbol size | Symbol size. Used in conjunction with selected “Symbol.” | ||||
| Symbol | Select the symbol style to be used. It can be established more symbol layouts, see the section on configuring Adaptive. | ||||
| Width | Thickness of a line. Example: 5.0 | ||||
| Opacity | Set the transparency of the theme. Enter integer from 0-100.
A value of 100 is opaque and 0 is fully transparent. If no value is specified will be the same as opaque. |
||||
| Angle | Angle, in degrees. Used together with “Symbol” to set the angle of the symbols. It may also be selected from a column in the data set if this has column values can be used to set angle. | ||||
| Gap | Distance between symbols (default to the number of pixels). Only to be used together with “Symbol”. Integer used. | ||||
| Initial gap | Used together with “Gap” and “Pattern” and indicates the distance (default to pixels) to:
|
||||
| Line cap | Specifies how the end of a line or a “stipple” should look like
Ref.: http://mapserver.org/mapfile/symbology/construction.html#linecap
|
||||
| Line join | Specifies how the line appears in breakpoints
Ref.: http://mapserver.org/mapfile/symbology/construction.html#linejoin
|
||||
| Pattern |
Used to specify a dotted pattern. This applies, for example, lines, contours on surfaces and certain hatches on surfaces (hatch). The syntax is a set distance / length stipple and distance / length of the space between each stippel. Exampel: 10 10 The above example provides 10 pixels with stippel then 10 pixels of gap / space.
Exampel: 10 20 5 20 5 20 The above example provides 10 pixels stippel, 20 pixel spaces, 5 pixels stippel, 20 pixels apart, five pixels stippel, 20 pixels spacing
|
Cluster | |||
| Group | A expression can be entered to create separate groups for each value | ||||
| Group type | Type of group. Used together with «Group».
|
||||
| Filter | A expression for what objekts that are to be touched by clustringen.
|
||||
| Filter type | Filter type. Used together with «Filter». | ||||
| Region | Defines search areas that will form the basis for clustringen.
|
||||
| Max distance | Defines the distance in pixels between regions / paging areas. | ||||
| Buffer | Defines a buffer in pixels around a map to capture any objects that fall outside the regions / search areas. |
The various elements above are based on Mapserver’s setup this. One excerpt of the most important elements are included. For details on the individual appears to Mapserver’s documentation on the subject:
- http://mapserver.org/mapfile/layer.html
- http://mapserver.org/mapfile/class.html
- http://mapserver.org/mapfile/style.html
- http://mapserver.org/mapfile/symbology/examples.html#symbology-examples
- http://mapserver.org/mapfile/symbology/construction.html
- http://mapserver.org/mapfile/expressions.html
- http://mapserver.org/mapfile/cluster.html