

“Dataviews” opens the possibility to view, edit, delete, and create new dataviews.

| Name | Description |
|---|---|
| Name | Name of dataview |
| Description | A description of dataview |
| Active | Determines if dataview is active or not |
To add a new data view click ![]() . This will open a dialog box with several fields to fill, as shown below:
. This will open a dialog box with several fields to fill, as shown below:
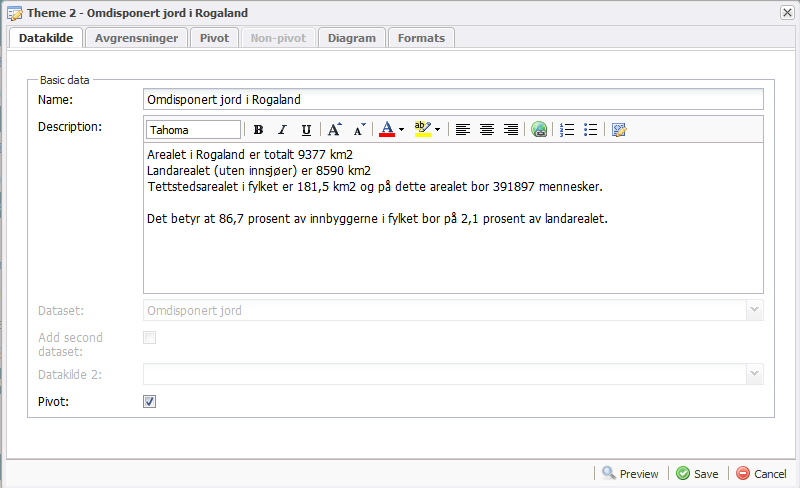
| Name | Description | Editable |
|---|---|---|
| Name | Name of the dataview, will be displayed in Adaptive | Yes |
| Description | Description of dataview | Yes |
| Dataset | Select to which dataset you want to connect the dataview | No |
| Add second dataset | Check the box if you want to add an additional dataset | No |
| Datakilde 2 | If you have opted for two datasets, select the second dataset here | No |
| Pivot | Enable/ disable pivot table | Yes |
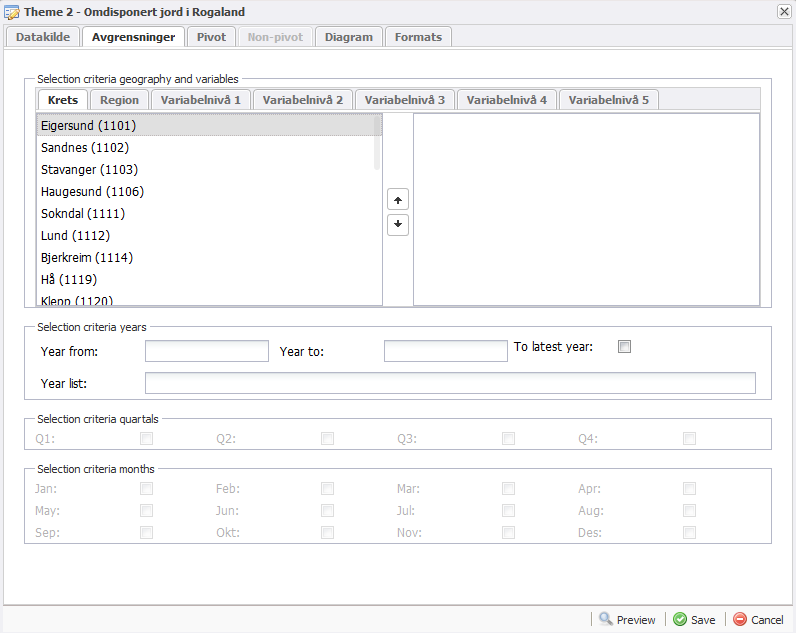
| Name | Description | Editable |
|---|---|---|
| Selection criteria geography and vairables | Select geographic and variables condition | Yes |
| Year from | Year from | Yes |
| Year to | Year to | Yes |
| To latest year | Check if data from latest year should be included | Yes |
| Year list | Number of years, if/when specific years are selected | No |
| Selection criteria quartales | Select desired quarter | Yes |
| Selection criteria months | Select desired months | Yes |
The picture below will appear only if “Pivot” is enabled:

| Name | Description | Editable |
|---|---|---|
| Row definition | Select desired rows and columns by double-clicking the desired row/column. Choose the order by highlighting a row and pressing the arrows marked in red | Yes |
| Rows or columns | Choose whether you want extra rows or columns | Yes |
| Add row/column | Select a function that you want to add to the row or column | Yes |
| Row/column title | Title of new row/column | Yes |
| Row/column definition | Type a definition for the row/column | No |
| Include row/column in chart | Enabled when all fields for a new row or column is filled. Gives the possibility to choose whether to include this row / column into the charts | Yes |
Picture below are only displayed if “Pivot” is not selected:

| Name | Description | Editable |
|---|---|---|
| Row definition | Select columns to include | Yes |

| Name | Description | Editable |
| Organisering | Select organizing charts | Yes |
| Adaptive theme | Check if you want to show as a theme in Adaptive | Yes |
| Geometry type | Define if the geometry should be point or polygon | Yes |
| A3 symbol | Define symbol type | Yes |
| A3 symbol color | Define symbol color | Yes |
| A3 outline color | Define a color for outlines | Yes |
| A3 symbol size | Define a symbol size | Yes |
| A3 outline size | Define a width for outlines | Yes |
| A3 opacity | Define a degree of transparency where 100 is non-transparent | Yes |
| Data column for A3 class | Select a column for the theme | Yes |
| A3 class data-intervals | Define data intervals, if desired | Yes |
| Diagramtype | Select a type of chart from the list | Yes |
| Diagramtittel | Enter a title for the chart | Yes |
| Charts from rows/columns | Choose whether charts should be created from rows or columns | Yes |
| Exclude values at position (see preview) | Enter values to be excluded, if desired | Yes |
| Series in chart | Select the series to be included in the charts | Yes |
| Intervals | Selected intervals for choropleth maps and Adaptive themes (read description in separate window) | Yes |
| Color palette | Select a color palette from the list | Yes |

| Name | Description | Editable |
|---|---|---|
| Number of decimals | Define a number of decimals for desired accuracy | Yes |
| Rounding numbers | Select whether rounding off should take effect, and – if so – to which value | Yes |