
In this example, the theme is divided into four classes (Arealdekkepunkter, Lufthavn, Mindre tettbebyggelse, Større tettbebyggelse), each category with a separate fill color (Fill color), symbol type (Symbol) and size of the symbol (Symbol size).
The class “Arealdekkepunkter” is set to appear in scales up to 1: 150 0000 (Minscale). When the user zooms in beyond this, the other classes take over. Those are set to appear from a scale of 1: 150 0000 (Maxscale). This means that at overview zoom level, all points are displayed with the same symbolization, and when the user zooms in to a scale from 1: 1 to 1: 150 0000 the points are being distributed to separate classes with specific symbols and colors.
To define which points belong to which class (Lufthavn, Mindre tettbebyggelse and Større tettbebyggelse), we’re using the type (Expression type) “Logical expression”. This allows the construction of a more sophisticated expression (Expression). Example:
- Lufthavn: ‘[objtype]’=’Lufthavn’
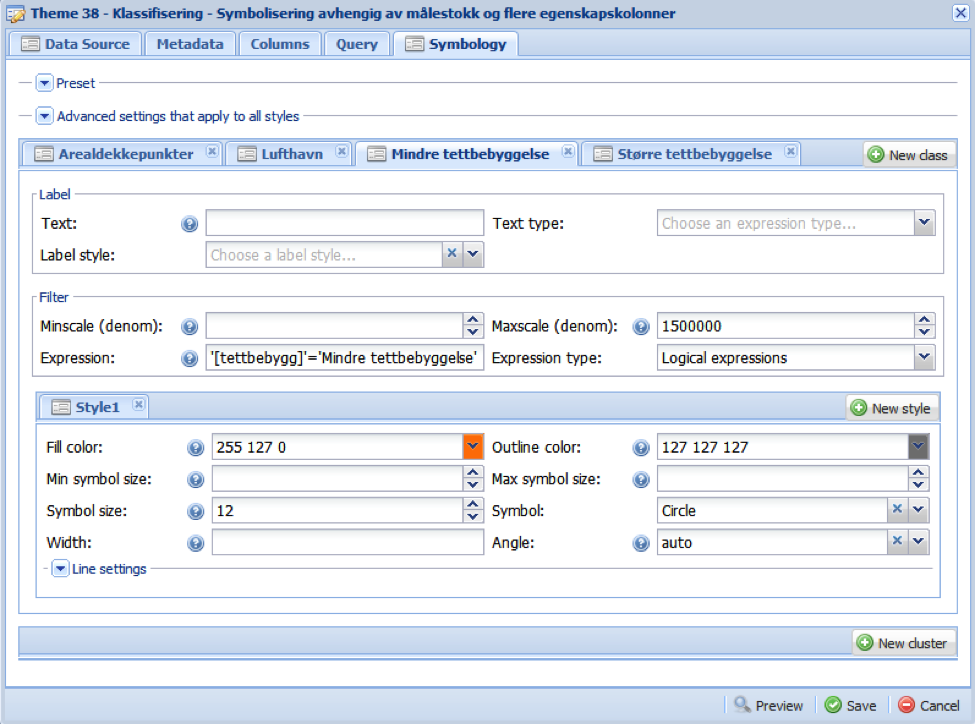
- Mindre tettbebyggelse: ‘[tettbebygg]’=’Mindre tettbebyggelse’
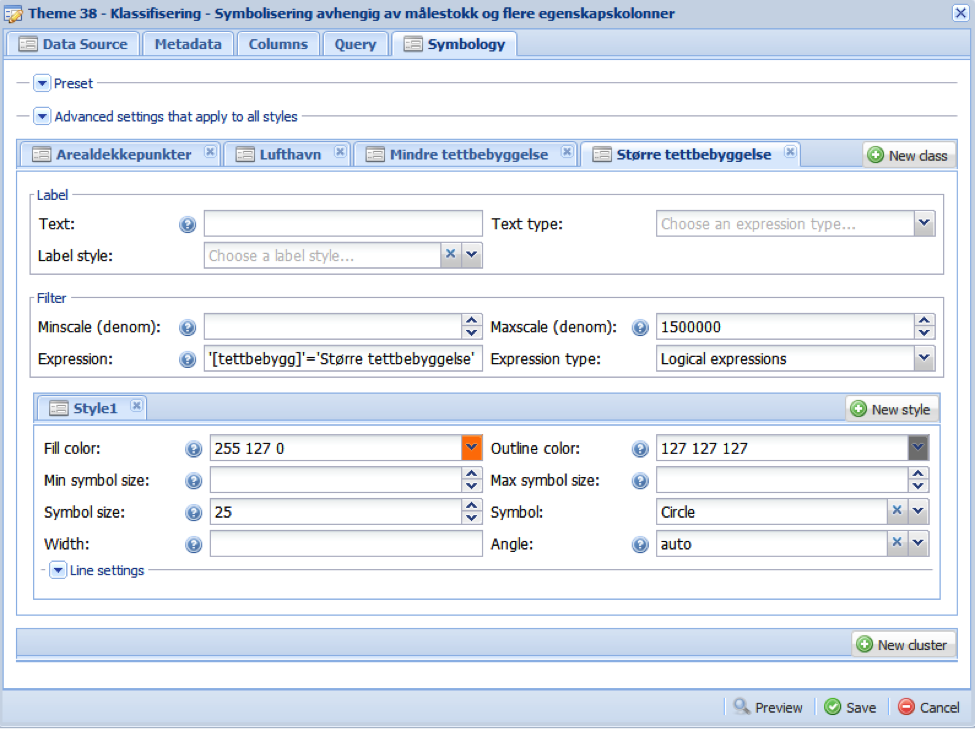
- Større tettbebyggelse: ‘[tettbebygg]’=’Større tettbebyggelse’
This way, columns, comparison operators and values can be set. The columns are enclosed in square brackets “[]”. If the column is of type text, the column name should be enclosed in square brackets and the values enclosed in single apostrophes.
In the above example the comparison operator = is being used.
Below is a screenshot for each class:


Example on legend, up to 1:150.000
![]()
Legend example, from 1.1 – 1:150.000

Map example, up to 1:150.000
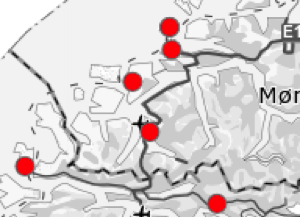
Map example, from 1:1 – 1:150.000
